
基本介紹
因子得分(factor score)是一種估計值,是在因子分析中,對不可觀測的公因子做出的估計值。因子分析是將變數分解為公因子和特殊因子的線性組合。由於m個公因子能反映原p個變數的相關關係(m<p),故反過來考察,將公因子表成變數的線性組合F=bx+bx+…+bx(j=1,2,…,m),如能估出b,就可以估計F的值,稱之為公因子F的得分。這樣,就把p維空間的問題化為m (m<p)維空間的問題,在低維空間R中,進一步考察樣本分類或把樣本的公因子得分作為進一步分析的原始數據 。
相關分析
因子分析模型建立後,還有一個重要的作用是套用因子分析模型去評價每個樣本存整個模型中的地位,即進行綜合評價。例如,地區經濟發展的因子分析模型建立後,我們希望知道每個地區經濟發展的情況,把區域經濟劃分歸類,以清晰地看出哪些地區發展較快,哪些地區發展不快不慢,哪些地區發展較慢等。這時需要將公共因子用變數的線性組合來表示,也即由地區經濟的各項指標值來估計它的因子得分。
設公共因子F由變數x表示的線性組合為:
 因子得分
因子得分 因子得分
因子得分 因子得分
因子得分該式稱為 因子得分函式,由它來計算每個樣品的公共因子得分。若取m=2,則將每個樣品的p個變數代入上式即可算出每個樣品的因子得分和,並將其在平面上作九子得分散點圖,進而對樣品進行分類或對原始數據進行更深入的研究,
但因子得分函式中方程的個數m小於變數的個數p,所以並不能精確計算出因子得分,只能對因子得分進行估計。估計因子得分的方法較多,常用的有回歸(regression)估計法和Bartlett估計法(也稱加權最小二乘法) 。
估計因子得分的方法
回歸估計法
 因子得分
因子得分設因子對p個變數的舊歸模型為
 因子得分
因子得分 因子得分
因子得分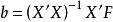 因子得分
因子得分 因子得分
因子得分因為變數和因子均已標準化,所以,上式可寫成矩陣形式,根據最小二乘估計,有,又由於因子載荷矩陣,於是:
 因子得分
因子得分 因子得分
因子得分這裡R為相關陣,且。
Bartlett估計法
Bartlett估計因子得分可由最小二乘法或極大似然法導出,下面給出最小二乘法求解Bartlett因子得分。
 因子得分
因子得分 因子得分 因子得分 因子得分
在因子分析模型中,若將載荷矩陣A看作自變數的數據矩陣,將X看作因變數的數據向量,將F看作未知的回歸係數,將看作隨機誤差,那么因子分析模型就是一個回歸模型。由於的方差各不相同,需將異方差的化為同方差,將下述模型進行變換:
 因子得分
因子得分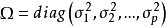 因子得分
因子得分變成同方差回歸模型。這裡,利用最小二乘法,可求得因子得分的估計值 :
 因子得分
因子得分